March 12, 2005
New Urbanist Philip Langdon says that new data show that housing in Portland is not as unaffordable as once believed. This proves, he says, that Portland's urban-growth boundary did not decrease the region's affordability.
Langdon should have dug a little deeper. Using the best available data -- the 1990 and 2000 U.S. censuses, which estimated both median-family incomes and median home prices by urban areas -- Portland's affordability declined by more than any other urban area in the U.S.
In the March 2005 issue of New Urban News, New Urbanist Philip Langdon argues that the "urban growth boundary did not make Portland unaffordable." Langdon's claim shows how important it is to get the best possible data before reaching your conclusions.
Langdon is the author of "A Better Place to Live," which argues that suburbs should be redesigned to look like his home city of New Haven, Connecticut: in other words, with the dense, mixed-use neighborhoods so beloved of the New Urbanists. In his latest article, he reveals that the National Association of Home Builders had used erroneous data in its housing affordability index. Since smart-growth skeptics such as Wendell Cox and me relied on that faulty index to conclude that Portland experienced the fastest decline in affordability of any U.S. housing market in the 1990s, Langdon triumphantly announces we must be wrong.
I always prefer data over personal experiences, which can be selective and biased. But, unlike Langdon, I lived in Portland through the 1990s, and it was obvious to almost anyone who lived there during that time that the region's housing affordability dramatically declined as housing prices increased far faster than personal incomes.
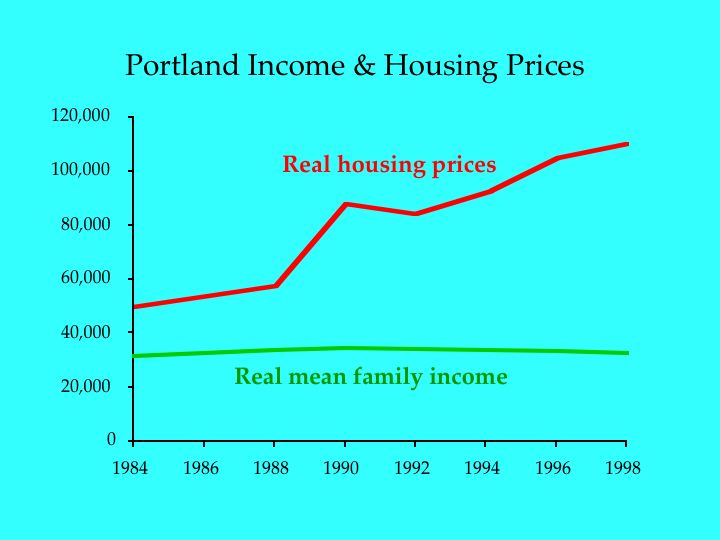
The data we had available said that, between 1988 and 1998, the region's real (i.e., inflation-adjusted) median family incomes remained flat or even declined slightly, while housing prices more than doubled (see chart below). Using the National Association of Home Builders' Housing Opportunity Index, which estimates the percentage of homes affordable to a median-income family, Portland's affordability declined from about 67 percent to a low of 26 percent. No other region experienced such a decline in this time period.
To calculate its index, the National Association of Home Builders relied on median-income data published by the Department of Housing and Urban Development (HUD). HUD uses these data to determine which families in different metropolitan areas have incomes low enough to be eligible for federal housing assistance.
Apparently, as Langdon discovered, HUD estimates of median-family income aren't particularly accurate. For the most accurate information, HUD relies on the decennial census, which gathers income data and calculates median-family incomes. In between the censuses, HUD bases its estimates on more limited sources of data.
In 2003, HUD "recalibrated" its income estimates using information from the 2000 census. This revealed that Portland's median-family income was $8,600 higher than HUD had thought. This shows, says Langdon, that Portland's affordability didn't decline as much as everyone thought. Of course, this doesn't prove that Portland's affordability didn't decline or that the decline wasn't due to the urban-growth boundary.
Since the most reliable data come from the decennial census, and the census also estimates the value of owner-occupied homes, I downloaded 1990 and 2000 median-family incomes (table P107A in the 1990 census and P77 in the 2000 census) and median-home values (table H061A in the 1990 census and H85 in the 2000 census) for every urbanized area (the numbers actually apply to 1989 and 1999). An urbanized area is a city and its suburbs that together add up to 50,000 or more people.
The U.S. had some 400 urbanized areas in 1990, and about 50 more in 2000, partly because the Census Bureau split a few urbanized areas up. It also merged a few other urbanized areas, notably Miami and Ft. Lauderdale. Without going to the trouble of merging and splitting data -- which would not have significantly changed the rankings -- I was able to find more than 350 urbanized areas in common between the two censuses.
For each urbanized area in each census I made a simple calculation of affordability: median-home value divided by median-family income. The most affordable regions have a home-price-to-income ratio of less than 2, meaning that a median family could buy a median home by devoting 100 percent of their income to the house cost for two or fewer years. More realistically, 25 percent of their income could pay off a 6-percent mortgage in under 12 years. Nearly 200 regions met this affordability test in 2000, including Dallas-Ft. Worth, Houston, and San Antonio.
The table below shows how many years a median-income family would need to buy a median-priced home by dedicating 25 percent or 33 percent of their incomes to a 6-percent mortgage. Blanks in the bottom two categories mean that the house could not ever be paid off, so these are ranked "very" to "extremely unaffordable." Since lenders are reluctant to give mortgages to people who would have to spend more than 30 percent of their incomes on the mortgage plus property taxes and insurance, regions with price-to-income ratios of 3 or more are considered marginal to unaffordable.
PtoI      Typical     Mortgage (years)   # of     Affordable?
Ratio      Region        25%     33%    Regions
1.5        Topeka        7.7     5.5       14     Extremely affordable
1.75       Dallas        9.4     6.6       65     Very affordable
2.0      Cincinnati     11.2     7.8      126     Affordable
3.0       Portland      21.9    13.5      210     Marginally affordable
4.0       San Diego     55.2    22.3       25     Unaffordable
5.0       San Jose       -      41.2        8     Very unaffordable
6.0     Santa Barbara    -       -          7     Extremely unaffordable
The number of regions in each group is the number below that price-to-income ratio down to the next one. In other words, 14 regions have price-to-income ratios of less than 1.5 and some 210 regions have ratios of between 2.0 and 3.0. The exception is the last category, which includes 5 regions whose ratios are between 5.0 and 6.0 and 2 regions whose ratios are above 6.0. The table also lists regions typical of each ratio; for example, Portland is approximately 3.0 (actually 2.96).
To calculate the change in affordability between 1990 and 2000, I simply divided the 2000 price-to-income ratios by the 1990 ratios. Nationally, the ratios remained at almost exactly 2.23 between 1990 and 2000, indicating that incomes rose at the same rate as home prices. In just the urbanized areas, ratios declined -- that is, affordability increased -- from an average of 2.32 to 2.25. Affordability improved in about half of all urbanized areas and decreased in the other half.
As can be seen in the complete spreadsheet, the fifteen regions with the greatest increases in price-to-income ratios -- that is, the greatest declines in affordability -- are:
                             Increase in Price-
Urbanized Area                to-Income Ratio
Portland, Vancouver, OR-WA          53%
Salem, OR                           44%
Longview, WA-OR                     44%
Eugene, OR                          42%
Salt Lake City, UT                  38%
Boulder, CO                         38%
Bay City, MI                        38%
Yakima, WA                          37%
Flint, MI                           36%
Jackson, MI                         35%
Medford, OR                         34%
Missoula, MT                        33%
Longmont, CO                        33%
Ogden, UT                           33%
Provo-Orem, UT                      33%
The actual price-to-income ratios for Portland, Salem, Eugene, and Medford grew from around 2 to nearly 3, meaning these communities went from very affordable to marginally affordable. While Portland is not as unaffordable as San Francisco, its affordability declined more than any other urbanized area in the nation.
All Oregon cities, including Portland, Salem, Eugene, Medford, and Rainier (which is in the Longview urbanized area) have urban-growth boundaries. Boulder and Longmont, Colorado, also have urban boundaries in the form of a regional urban-service boundary supplemented by greenbelts. Missoula has had an urban-service boundary for more than a decade, Washington passed a growth-management act in 1991, and Ogden and other Utah cities face natural boundaries in the form of lakes and national forests. The Michigan cities went from an extremely affordable 1.3 to a very affordable 1.75, which no doubt has more to do with cycles in the auto industry than land supply.
Most of the remaining areas with large increases in price-to-income ratios fall into two categories. Many, like the Michigan cities, were extremely affordable to very affordable in 1989 and remained very affordable t affordable in 1999. But a number of others grew to be only marginally affordable in 1999, including Denver, Santa Fe, Ft. Collins, and Bellingham. These latter regions all use some form of growth-management planning.
This does not prove that urban-growth boundaries caused the decline in affordability in Oregon cities. In fact, I have never said that the urban-growth boundary alone caused that decline. Also contributing to the decline were:
Yet the urban-growth boundary played a significant role in the decline of affordability. In 1990, home builders could buy vacant residential land within the Portland boundary for around $20,000 an acre. By 2000, prices had soared to as much as $300,000 an acre. The region had plenty of land suitable for housing, but nearly all of it was outside the boundary. Thus, an artificial land shortage helped drive up home prices.
According to the numbers Langdon cites in his article, Portland's price-to-income ratio increased even further from 2.96 percent in 1999 to 3.05 percent in 2003. This was based on a HUD-estimated median-family income of $65,800, which was $10,000 more than the Census Bureau had estimated for 1999. This may be optimistic: Portland's unemployment rate grew from less than 4 percent at the end of 1999 to nearly 9 percent in 2003, making it the highest in the nation. This suggests that HUD's recalibrated income might have been too high. Despite high unemployment, Portland housing prices increased by 16 percent during that same time period, suggesting that affordability continued to decline.
Langdon adds other information that he says "casts further doubt" on the claim that the urban-growth boundary drove up housing prices. He notes that many Portland neighborhoods were "transformed" as people invested 45 percent more than the national average in home remodeling. This "made their homes more valuable and enhanced the desirability of their neighborhoods."
There is a dark side to this urban revival story. Because the urban-growth boundary and other smart-growth policies priced many young urban professionals out of the suburban home market, they instead gentrified low-income, often minority, neighborhoods that had previously been largely occupied by renters. As documented by a smart-growth group called Coalition for a Livable Future in a report called "Displacement: The Dismantling of a Community," the low-income renters were dispersed to other parts of the region (email teresa@clfuture.org to get a copy of this report). Many can now be found in high-density apartments that had been built as "transit-oriented developments" but in reality are little better than tenements.
Gentrification has its benefits, but low-income families hate it because it destabilizes their lives and can reduce the quality of their housing. Good or bad, Portland's gentrification was largely a result of housing shortages caused by the urban-growth boundary, so it hardly supports Langdon's claim that the boundary did not reduce affordability.
The National Association of Home Builders relied on the best data available to estimate housing affordability for various regions, but the best was none too good. The 2000 census revealed that incomes in some regions rose faster than assumed by the Department of Housing and Urban Development.
But Philip Langdon prematurely jumped on this error to make conclusions without closely examining the source data. The best data available clearly show that Portland suffered the greatest decline in housing affordability of any urban area in the 1990s.
Yes, Portland's urban-growth boundary, along with other smart-growth policies, did reduce Portland's housing affordability. Yes, Portland's affordability declined in the 1990s by more than any other urban area. Yes, urban-growth boundaries or other smart-growth policies appear strongly correlated with reductions in affordability in other urban areas as well.
Lots of things influence affordability, but the data show that on average the home-price-to-income ratio has been and remains about 2.2 to 2.3 throughout the nation. This means that home builders are generally able to keep up with the demand for housing even in fast-growing communities. Housing shortages occur in growing regions mainly when government intervention such as growth boundaries, building limits, lengthy permitting processes, or other regulation prevents home builders with keeping up with demand.